


Snapdragon 8 Gen 2 vs Snapdragon 8 Gen 1: Year-on-year improvements

The Snapdragon 8 Gen 2 is the latest iteration of Qualcomm's flagship chipset, but how good is it really?
The Snapdragon 8 Gen 2 is very likely the best chipset in the business right now, and that's thanks to a number of factors. It has an incredibly powerful GPU, strong computational capabilities, and it'll be the backbone of many high-tier devices released in 2023. There's no question that it's a better SoC than the Snapdragon 8 Gen 1, but by how much?
As it turns out, it's a fairly substantial improvement. There are many reasons why that may be (even the Snapdragon 8 Plus Gen 1 managed to severely outclass the original Snapdragon 8 Gen 1), and it seems to boil down to efficiency. The Snapdragon 8 Gen 2 can do a lot more with the power it draws, whereas the Snapdragon 8 Gen 1 always struggled. Couple that with power limitations instituted by OEMs to tame the 8 Gen 1 because otherwise, they ended up with boiling hot devices, and you had a chipset that felt like it was underperforming for some people.
So, the Snapdragon 8 Gen 2 leapfrogs over the Snapdragon 8 Gen 1 in many different ways, but the reasons for that are atypical of normal year-on-year improvements. Such large improvements aren't sustainable, and the leap from the Snapdragon 8 Plus Gen 1, the chipset that the 8 Gen 1 basically should have been, to the Snapdragon 8 Gen 2 will be a lot smaller.
Fundamental differences
Given that the Snapdragon 8 Gen 2 is an iteration above the last generation, the design differences are minimal. The primary core is upgraded from a Cortex-X2-based design to a Cortex-X3-based one. Interestingly, Qualcomm has moved from having three performance cores to four, increasing the computational power significantly.
As a result, Qualcomm does remove one efficiency core, which worried me that it may have an impact on the overall efficiency of the smartphone. As you'll see later on, though, it doesn't seem to. Performance is still great, power consumption is well within a normal range, and the only question mark concerns the inclusion of two A710 cores rather than four A715 cores.
With the Snapdragon 8 Plus Gen 1, we saw massive improvements in both performance and efficiency in a way we would only typically see with a year-on-year improvement. Comparing the Snapdragon 8 Gen 2 to the Snapdragon 8 Gen 1 widens that gap in ways that would not be expected of a typical generational improvement. It's genuinely incredible to think of the computational gains one may get upgrading from something like the OnePlus 10 Pro to the OnePlus 11.
Benchmarks overview
GeekBench
A CPU-centric test that uses several computational workloads, including encryption, compression (text and images), rendering, physics simulations, computer vision, ray tracing, speech recognition, and convolutional neural network inference on images. The score breakdown gives specific metrics. The final score is weighted according to the designer’s considerations, placing a large emphasis on integer performance (65%), then float performance (30%), and finally, cryptography (5%).
GFXBench
Aims to simulate video game graphics rendering using the latest APIs. Lots of onscreen effects and high-quality textures. Newer tests use Vulkan, while legacy tests use OpenGL ES 3.1. The outputs are frames during the test and frames per second (the other number divided by the test length, essentially) instead of a weighted score.
Aztec Ruins
These tests are the most computationally heavy ones offered by GFXBench. Currently, top mobile chipsets cannot sustain 30 frames per second. Specifically, the test offers really high polygon count geometry, hardware tessellation, high-resolution textures, global illumination and plenty of shadow mapping, copious particle effects, as well as bloom and depth of field effects. Most of these techniques will stress the shader compute capabilities of the processor.
Manhattan ES 3.0/3.1
This test remains relevant given that modern games have already arrived at their proposed graphical fidelity and implement the same kinds of techniques. It features complex geometry employing multiple render targets, reflections (cubic maps), mesh rendering, many deferred lighting sources, along with bloom and depth of field in a post-processing pass.
CPU Throttling Test
This app repeats a simple multithreaded test in C for as short as 15 minutes, though we ran it for 30 minutes. The app charts the score over time so you can see when the phone starts throttling. The score is measured in GIPS — or billion operations per second.
Burnout Benchmark
Loads different SoC components with heavy workloads to analyze their power consumption, thermal throttling, and their maximum performance. It uses Android’s BatteryManager API to calculate the watts being used during testing, which can be used to understand the battery drain on a smartphone.
Computational workload
These tests were conducted using Geekbench 5 and not Geekbench 6, though we will be transitioning to using Geekbench 6 in future comparisons.
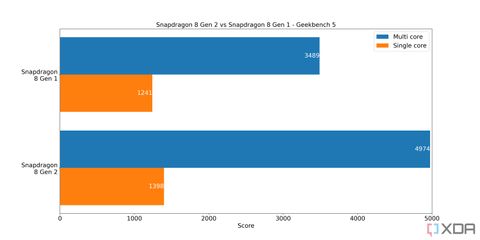
The Snapdragon 8 Gen 2 has some pretty big gains over the Snapdragon 8 Gen 1 in this test, particularly regarding multithreaded workloads. Single-core improvements are noted, though there's "only" a 12.6% improvement. In contrast, multithreaded improvements amount to a 41.7% increase, which is fairly substantial. Most processing on your smartphone is multithreaded, so these improvements are notable.
Qualcomm Snapdragon 8 Gen 2 vs Qualcomm Snapdragon 8 Gen 1: Power efficiency
Burnout Benchmark allows us to easily measure the power consumed by a chipset in a smartphone. The following tests are run on different components of the SoC as part of the Burnout Benchmark.
- GPU: Parallel vision-based computations using OpenCL
- CPU: Multi-threaded computations largely involving Arm Neon instructions
- NPU: AI models with typical machine learning ops
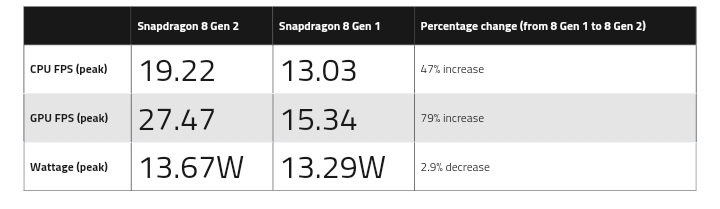
First and foremost, here are the power metrics that we collected.
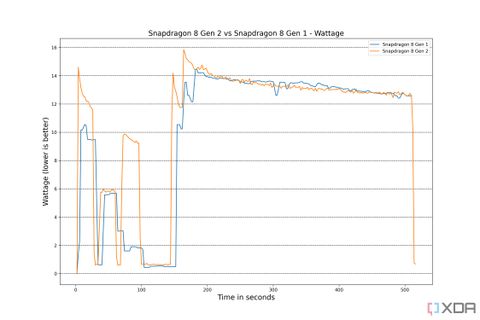
As you can see from the above graphs, these chipsets consume a similar amount of power when pushed to their extremes. 14W of drainage is a lot, but our phones basically never reach that aside from when we really push them intentionally. Gaming may bring it close, but even games have moments where the action dulls and is less intense.
However, that's only one side of the coin. While they consume similar amounts of power when pushed to extremes, the actual performance you get out of these two chips wildly differs.
Source: XDA Developers
Please sign in
Login and share